Capitanier/Platform/Capitanier BMS
Module 06

A BMS that not only shows the building's state but evaluates it.

The web-based system shows the building's technology in technology diagrams with live data from the PLC. AI reads the data continuously, evaluates it in context and, on alarm, looks for the cause based on technology dependencies. Operators do not have to watch screens around the clock.

Who it is forDispatching and building operatorsBuilding managers and operatorsIntegrators delivering visualisation
What you get

A result, not a list of features.

01

The building speaks up before something breaks

Unusual consumption, stuck values, low temperature difference, night-time water use. AI sees it continuously.

02

The cause, not just an alarm

On alarm, it looks for the cause based on dependencies and status history, not the alarm message alone.

03

From finding to action in one click

A request to WFM that guides the technician to clearing the fault.

What the module does

What exactly it does.

  • Equipment status online from any device, with no installation on the user's side.
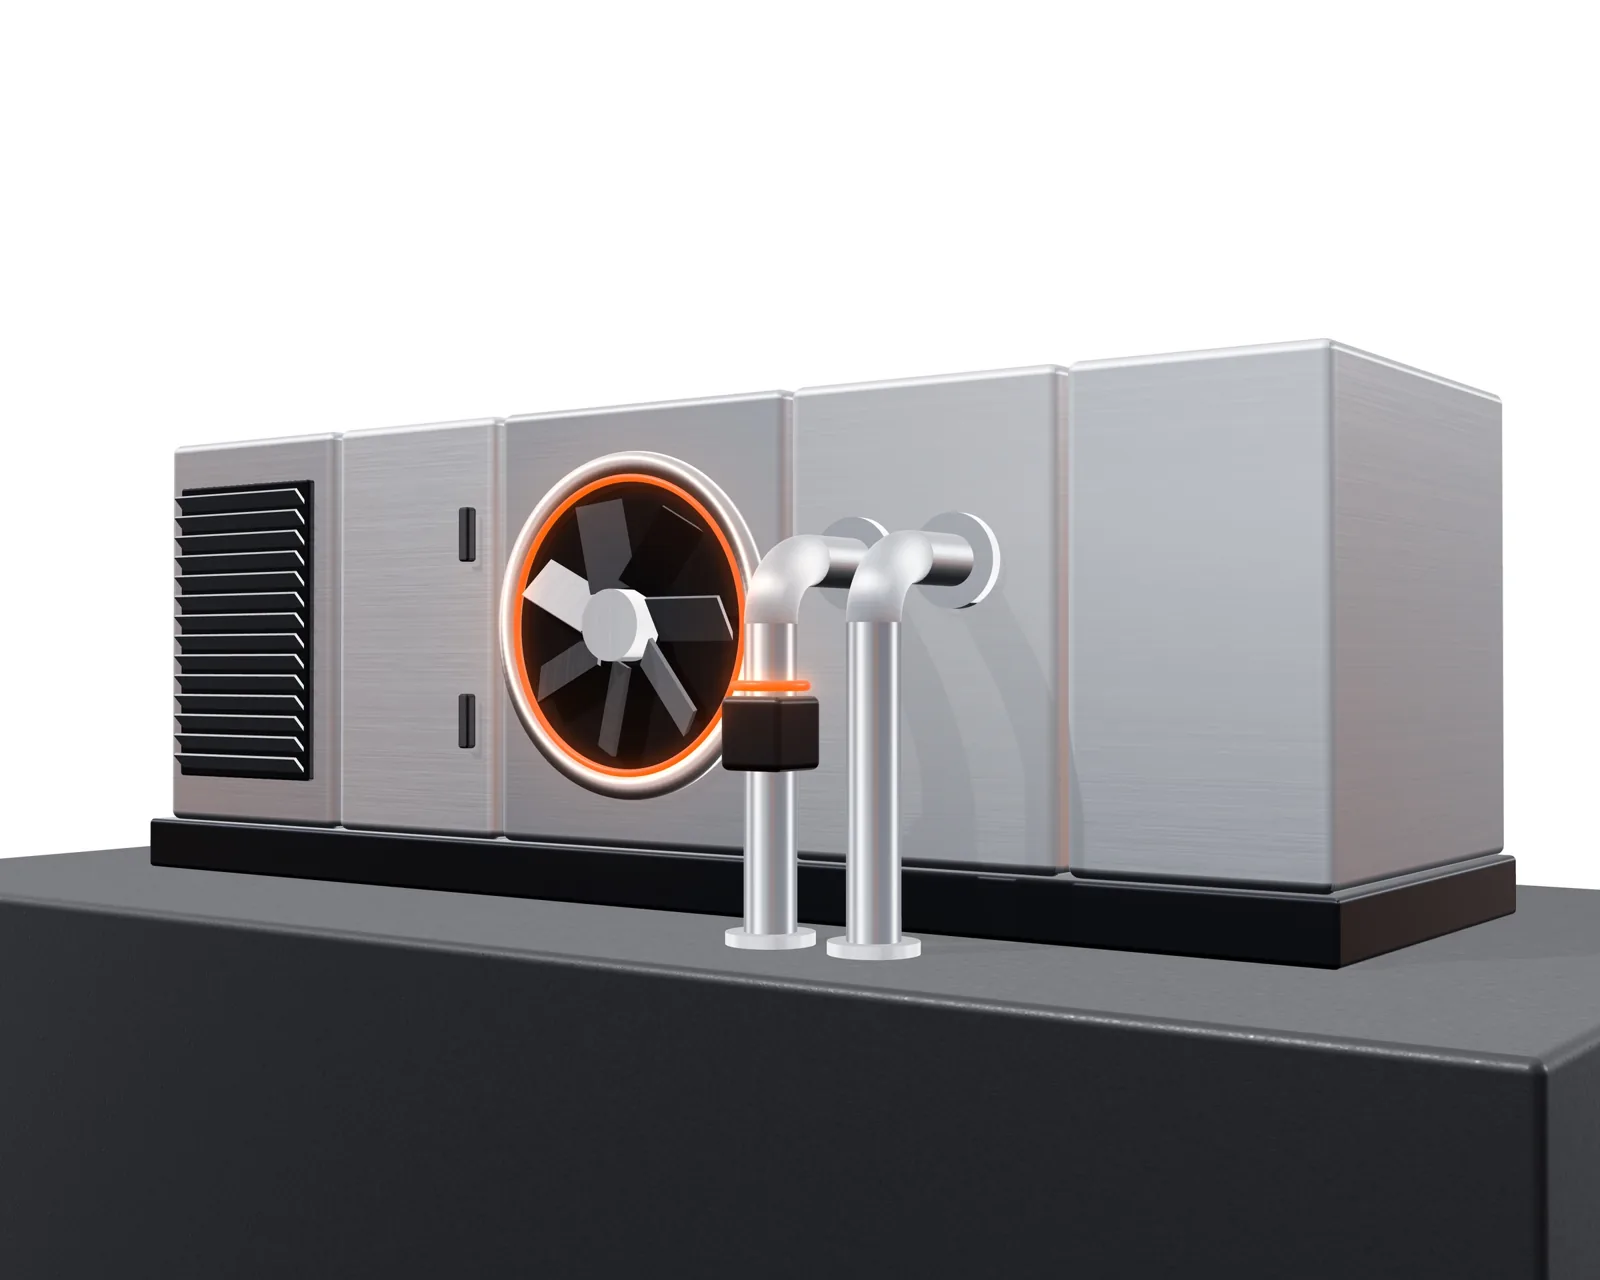
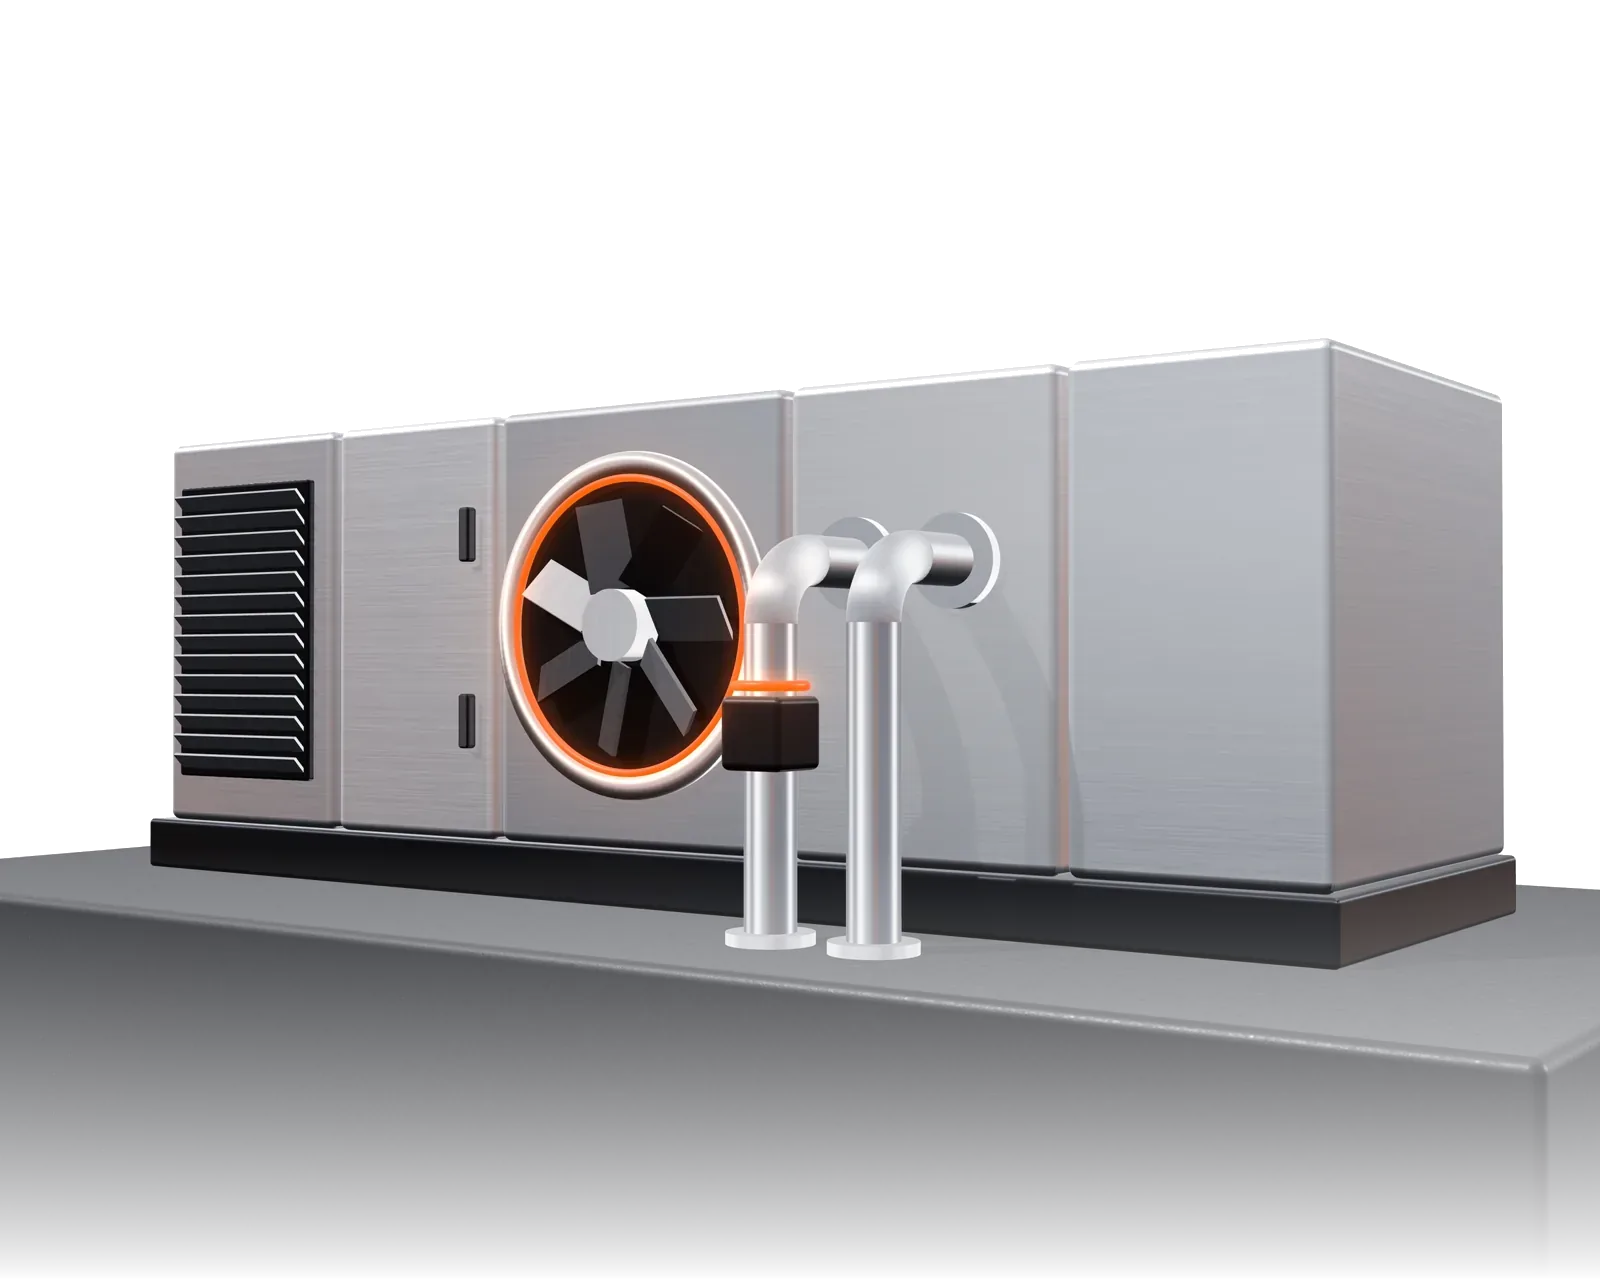
  • AI draws technology diagrams from the design documentation (TechSchema), animates them and connects them to the PLC. The diagrams show live data.
  • Trends and charts. Several curves in one chart, so relationships and causes are visible.
  • An alarm journal connected directly to the technology.
  • AI analytics: it recognises possible equipment problems early and prepares clear reports on the state of operation for operators and supervisors.
  • From every element of the diagram, one click to the device's documentation and history; link to maintenance and energy management.
How it is introduced

Four steps, no surprises.

Connecting the technology

Data from PLC and IoT via MQTT / AWS IoT, OPC UA.

Diagrams

From the design documentation with the help of AI, with the same tags as in the PLC.

Analytics

Reference behaviour of equipment, rules and deviation detection.

Dispatching

Status reports, alarms with cause, work requests to WFM.

Proven
Parker Hannifin, Chomutov

HVAC data from 4 control panels and 6 air-handling units, 227 signals, flow into Capitanier.

Frequently asked questions

The most frequent questions.

Does it replace our existing BMS?+
It can run alongside it as an AI analytics layer, or replace it. It depends on the state of the technology.
Which protocols do you support?+
MQTT / AWS IoT, OPC UA, others depending on the project.
Can the AI intervene in control?+
Only through approved measures with protective limits. By default it proposes and creates requests; it does not change the control by itself.
Next step

Book a demo

We will show you diagrams with live data and AI analytics on a real operation.