De-Engineering 03.3

AI draws technology diagrams, animates them and connects them to the PLC.

TechSchema is a technology diagram editor in which AI draws boiler rooms, heat substations, heating and cooling distribution, chillers and HVAC from the design documentation. The diagrams connect to PLC points and show live values, states and trends. They are the Capitanier BMS screens.

Who it is forIntegrators delivering visualisationDispatching and building operatorsBuilding managers who want to see the technology without installation
What you get

A result, not a list of features.

01

Visualisation without drawing

AI draws the diagram of a boiler room or air-handling unit from the documentation. The integrator adjusts it rather than creating it.

02

Live data right after connection

Diagram elements are bound to PLC points by the same tags as in FluxPlan and the program.

03

One click to the relationships

From every element of the diagram there is a path to the device's documentation, history and trends.

What AI creates and what the editor allows

What exactly it does.

  • AI draws the technology diagram from the design documentation: boiler room, heat substation, heating and cooling distribution, chiller, air-handling unit based on its code.
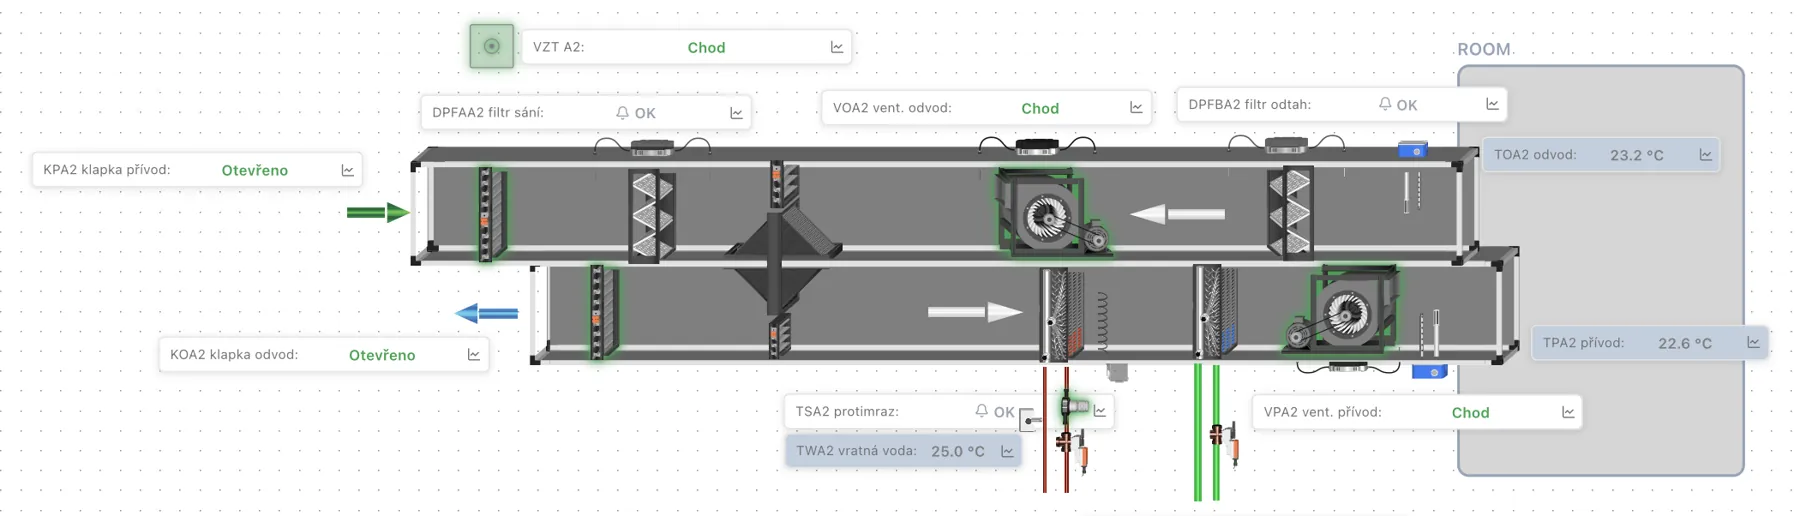
  • Animation: equipment states (running, idle, fault), sensor values, damper and valve positions, highlighting of running equipment.
  • Connection to the PLC via points with the same tags; data via MQTT / AWS IoT, OPC UA.
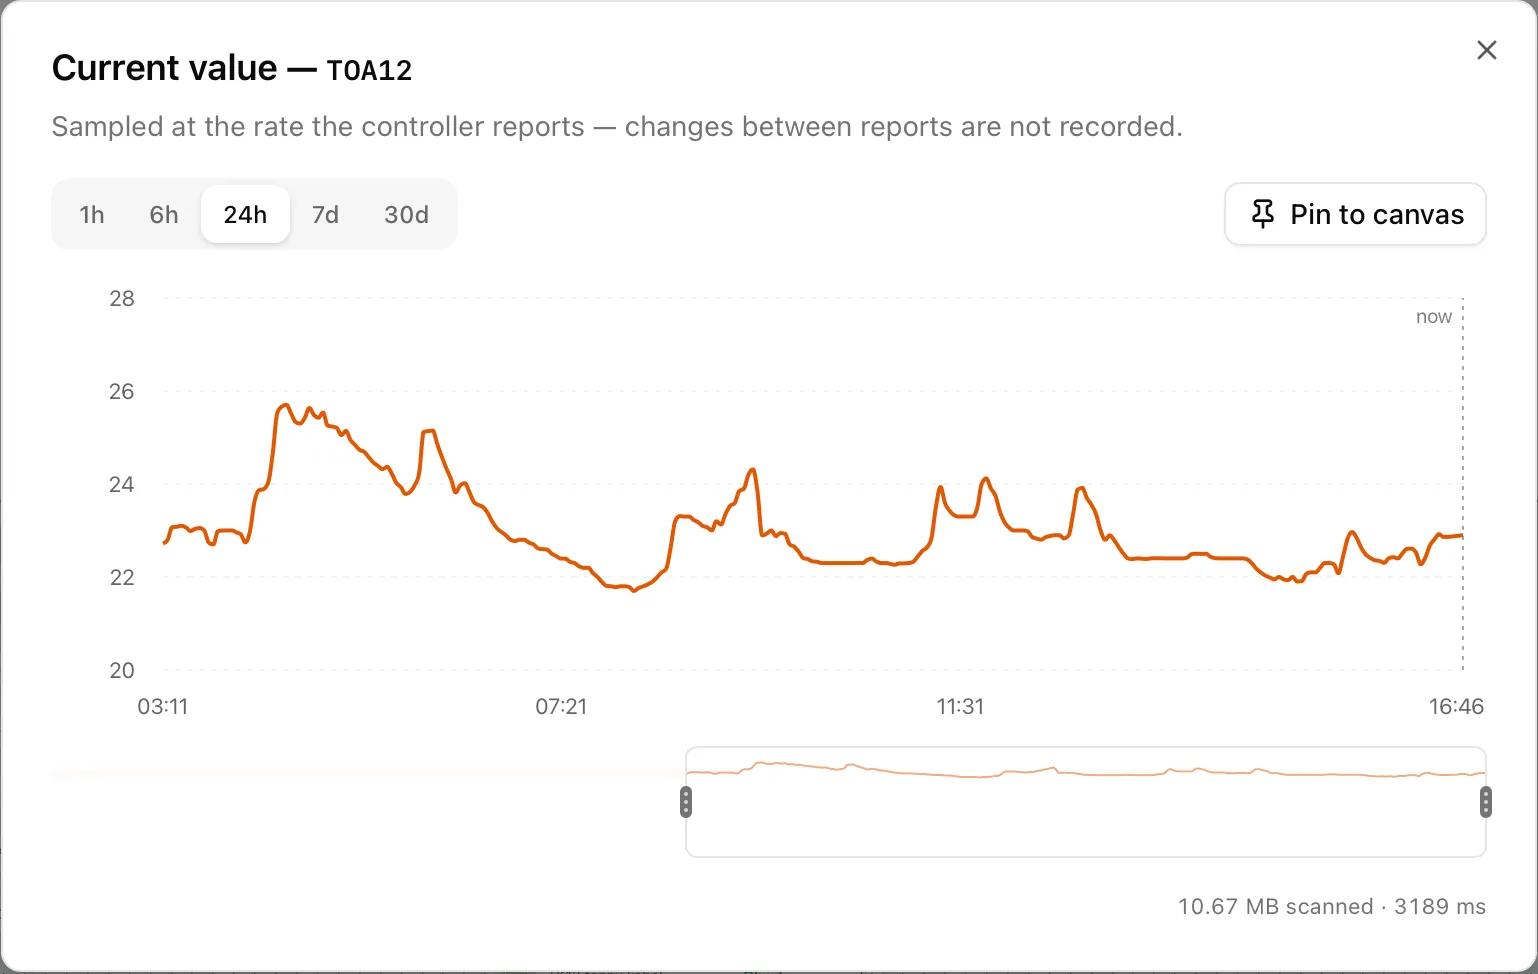
  • Trends directly from the diagram: 1 h to 30 days, several curves in one chart, pinning the chart to the canvas.
  • Alarm journal connected to the technology, AI analytics on the data (Capitanier BMS).
  • From every element, one click to the documentation, device history and a work request (WFM).
How it is carried out

Four steps, no surprises.

Documents

Technology diagram from the design, equipment list, PLC point list.

Drawing

AI draws the diagram; the integrator fine-tunes the layout and elements.

Connection

PLC points are assigned to diagram elements. Same tags = automatic matching.

Operation

Live data, trends, alarms, AI analytics. The diagram is the BMS screen.
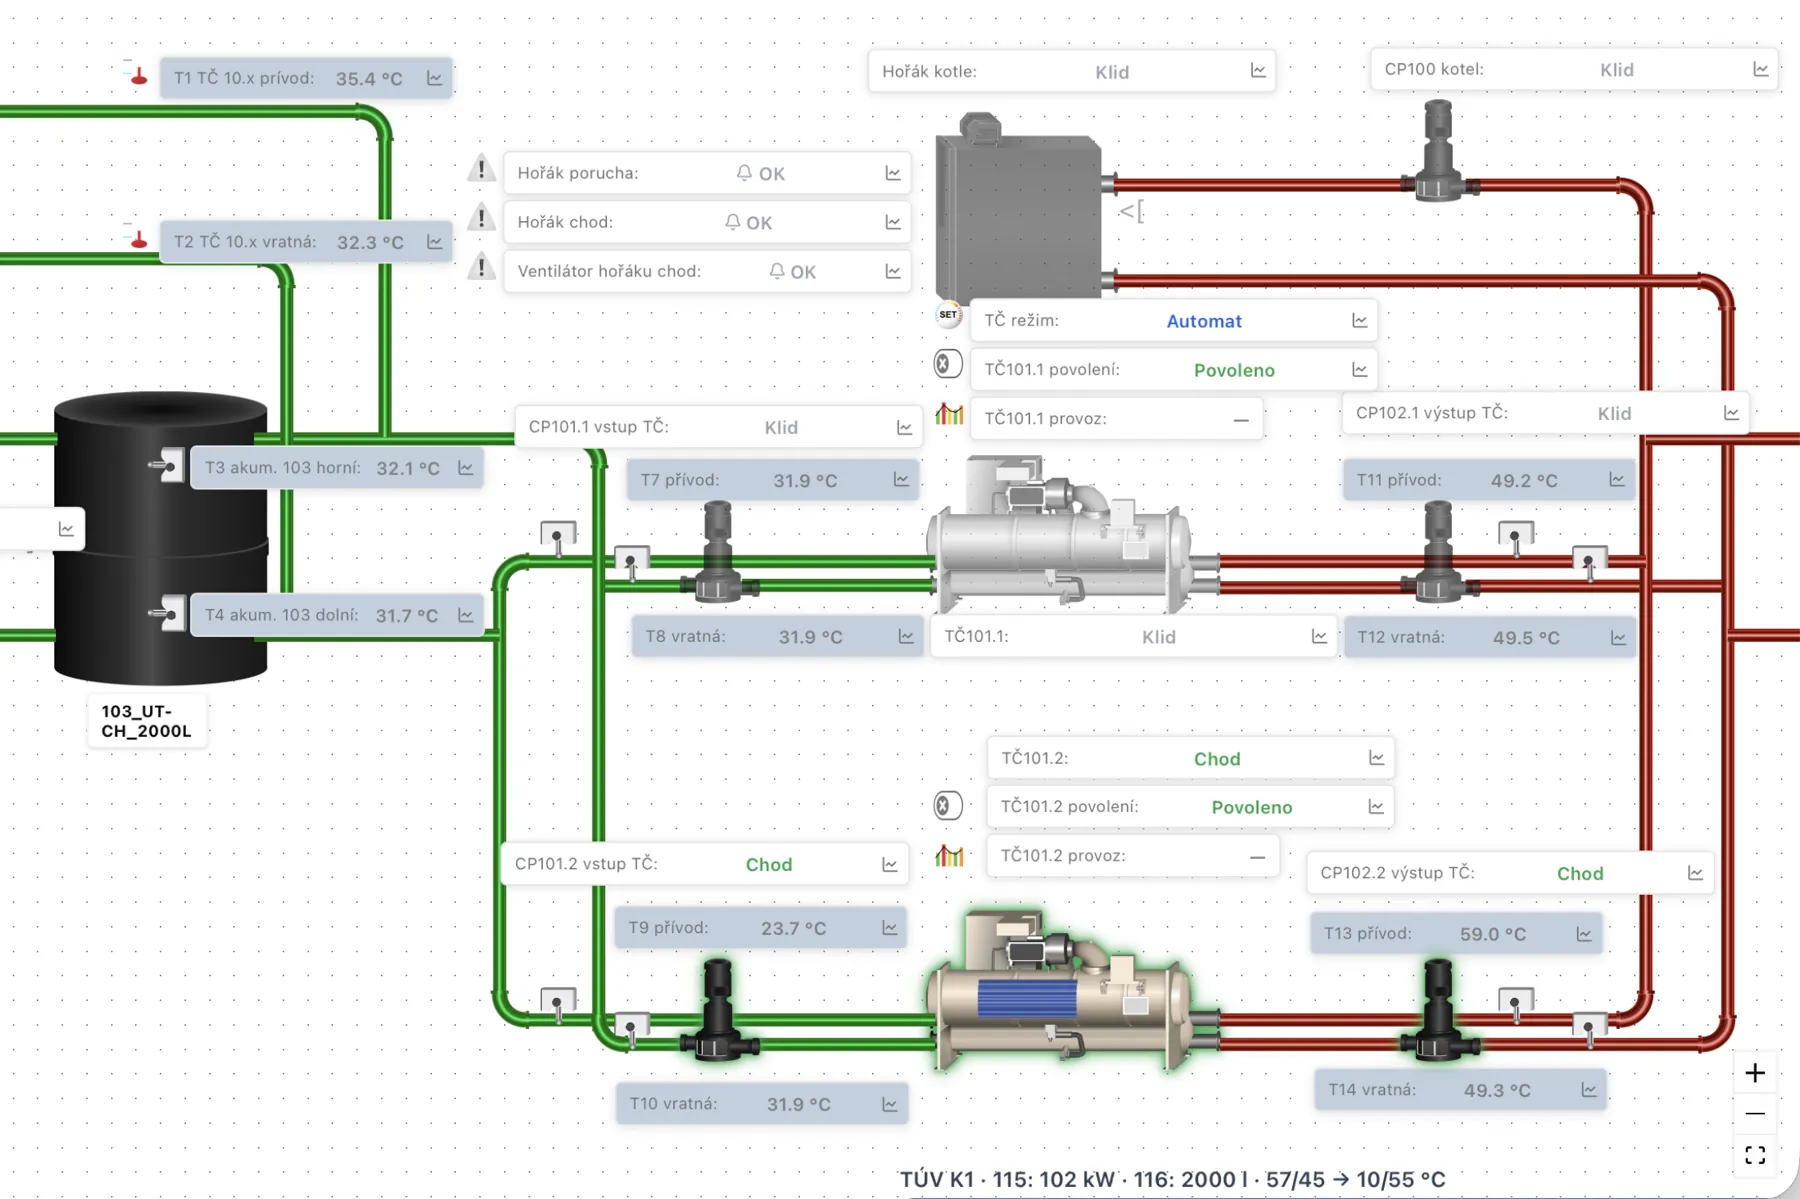
Example from a real operation

This is what it looks like in practice.

Boiler room with heat pumps and buffer storage: live temperatures, pump states, enables and modes.
Air-handling unit with the states of dampers, filters, fans and frost protection.
Value trend directly from the diagram, 1 h to 30 days, pinned to the canvas.
Frequently asked questions

The most frequent questions.

Do we need our own server or installation?+
No. TechSchema runs in the browser; data from the PLC goes to Capitanier over a secure connection.
Can it be used with an existing PLC?+
Yes, if the PLC provides points via a supported protocol.
Is it already a BMS?+
Diagrams with live data, trends and alarms are the foundation of Capitanier BMS. AI analytics and dispatcher support sit on top of them.
Next step

Book a demo

We will show you a diagram with live data on a real operation.